 The Long Read
The next digital renaissance: why AI coworkers are the beginning, not the end
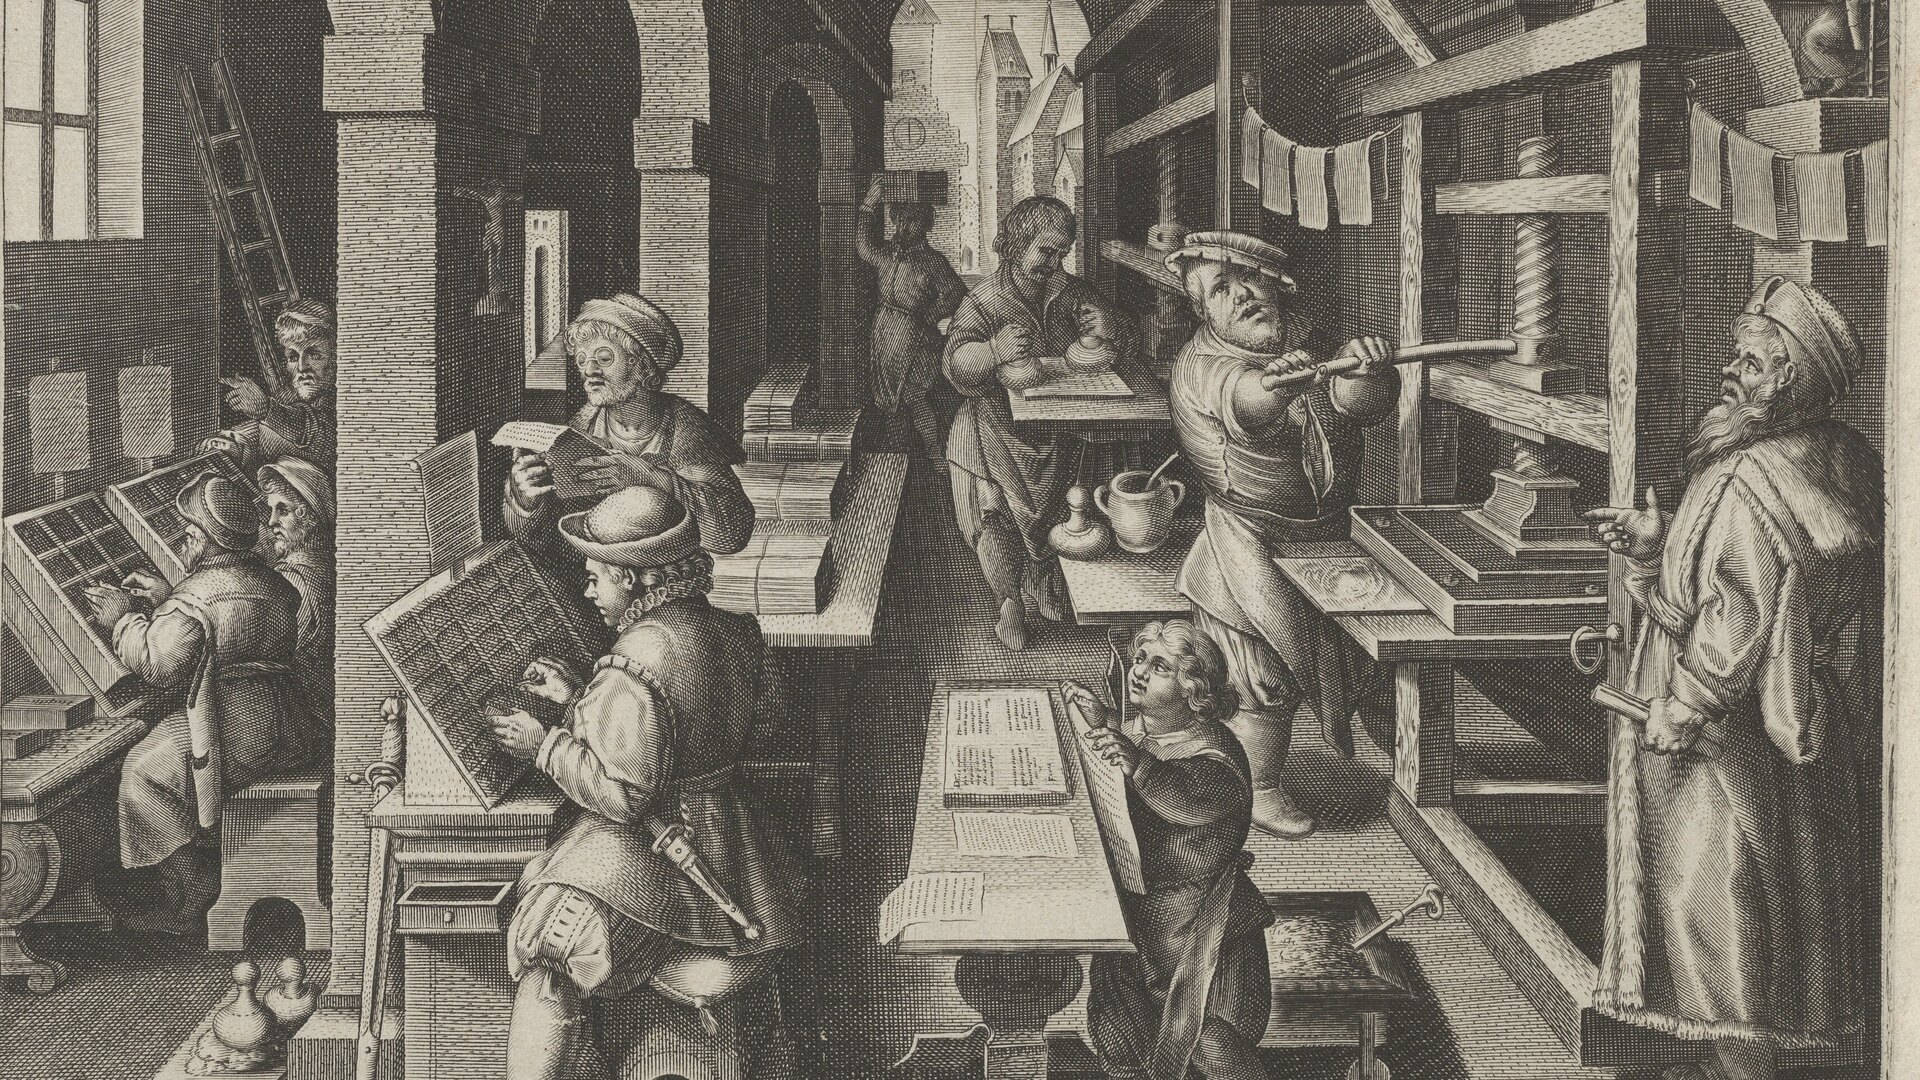
Jan Collaert after Jan van der Straet, The Invention of Book Printing, c. 1600

Vaughn DiMarco
2026-08-25
AI coworkers are real, and they are improving on a measured exponential. They are also failing to show up in almost anyone’s profit and loss. Both of those are true right now, and the gap between them is not a contradiction. It is the shape every general purpose technology has taken, including the one that gave us the first Renaissance.
Two true things
For six years running, the length of task a frontier agent can finish on its own has doubled roughly every seven months. That is METR’s measurement, not a vendor’s slide, and it has held through four model generations. Over the same period, MIT’s NANDA initiative looked at more than three hundred enterprise deployments and found that ninety five percent of them produced no measurable return in the accounts.
Most writing about AI picks one of those facts and pretends the other is noise. The bulls quote the curve. The skeptics quote the ninety five percent. I think you have to hold both, because the second number is what the first number looks like before the organisations catch up.
Fact one
2× / 7 months
The length of task a frontier agent finishes on its own, doubling on a cadence that has held for six years.
METR
Fact two
95% return nothing
Enterprise pilots with no measurable impact on profit and loss. Five in a hundred showed up in the accounts.
MIT NANDA
The models are ready. The organisations are not. Closing that gap, rather than waiting for better models, is the whole game.
That is the argument. What follows is the evidence for it, including the evidence against it, which is stronger than the people selling agents would like you to think.
The price of thinking fell by about ninety nine percent
In March 2023, running a million input tokens through GPT-4 cost thirty dollars. By 2026 the same class of intelligence sits at ten cents, and the tiers people actually deploy against sit between five and fifty cents. Stanford’s AI Index put the decline in inference cost per unit of quality at roughly two hundred and eighty times over about two years. Google went from processing nine point seven trillion tokens a month to over three point two quadrillion in the same window, which tells you demand outran the price collapse rather than being satisfied by it.
Figure 1
The published price of capable-model inference
Hover a point for its published price.
OpenAI published API pricing at each launch. The 2026 figure is the commodity tier described in Menlo Ventures' 2025 enterprise report. Log scale.
Do the arithmetic on one unit of delegated work. A customer support resolution that burns twenty thousand tokens of input and five thousand of output costs a cent or two in raw inference. Intercom sells that same resolution through Fin at ninety nine cents. A human contact, fully loaded, costs several dollars. The model is nearly free. The ninety seven cents in between is the system around it, and that is exactly where the money and the difficulty live.
BCG put numbers on the difficulty: about seventy percent of it is people and process, twenty percent technology, ten percent algorithms. Evals, integration, data cleanup, permissions, governance, change management. None of those costs are falling. Anyone waiting for a better model to fix a deployment is waiting on the one input that has already stopped being the constraint.
One more number, because it answers the obvious objection that cheap tokens are only cheap if nobody uses them. On OpenRouter, one of the larger public routers, agentic traffic passed human traffic on the sixth of February 2026 and has not looked back. Agents now burn about 7.3 trillion tokens on a seven day average, roughly fourteen times what they burned six months earlier and about five times what people consume directly.
Figure 1c
Who is actually spending the tokens
Compiled by Peter Walker of OpenRouter from the platform's own traffic, circulated by a16z. The crossover date, the 7.3 trillion figure and the 14x are as published; the shape between those points is traced from the published chart. OpenRouter is one router and says itself that it measures its own traffic rather than the whole market, and the agentic and human labels are its classification.
Two things follow. The first is that the machines are not waiting for permission: whatever the pilot statistics say about measured returns, something is already running at volume. The second is a detail that cuts the other way, and it is the more useful one. Most of that agentic burn is cached prompts, which are billed at a fraction of the standard rate. Agents are not thinking five times harder than people. They are re-reading the same context over and over, which is what a long chain of steps looks like from the billing side, and it is the same arithmetic that shows up two sections from now as the reason those chains break.
Interactive, figure 1b
Where the ninety seven cents actually goes
$0.018
raw inference, per resolution, at the good enough tier
what the tokens cost you
Intercom Fin, per resolution
fully loaded, typical
Tokens
$175
Agent, outcome priced
$9,900
All human
$45,000
At 10,000 resolutions a month, the tokens cost $175 and the outcome price is $9,900. The difference is the system, not the model.
Token prices are published API list prices for each tier as of 2026. The $0.99 resolution price is Intercom's published Fin rate. The human contact cost is a typical fully-loaded figure and varies widely by market and complexity.
›Why pricing moved off seats
Published per resolution rates in support: HubSpot Breeze at fifty cents, Intercom Fin at ninety nine cents, Zendesk between one dollar fifty and two dollars, Salesforce Agentforce at about two dollars a conversation, Sierra at roughly a dollar fifty. Enterprise contracts with Sierra, Decagon and Ada run from a hundred and fifty thousand to six hundred thousand a year and up.
The logic is that an agent is priced against the labour it displaces, not the seat it replaces. Bret Taylor makes the market case directly: four hundred billion dollars a year goes to customer service, and a bulk of that is moving to agents. Sierra took seven quarters to reach a hundred million in annual recurring revenue and two more to add the next hundred million, at a fifteen point eight billion dollar valuation.
What the machines can actually finish
METR’s time horizon metric is the most useful single number in this whole field, because it measures the thing managers actually care about. Not whether a model knows something, but how long a job it can be handed. A GPT-5 class agent completes tasks that take a human expert about two hours and seventeen minutes, at fifty percent reliability. Six years ago the equivalent figure was seconds.
Interactive, figure 2
Drag the year. Watch what an agent can finish.
2h 17m
measured range, at 50 percent reliability
Fits inside that window
- Reset one customer password2 min
- Triage an inbound support ticket8 min
- Reconcile a single invoice exception25 min
- Draft a job description from a brief60 min
- Close the books on one vendor account4 hr
- Build and ship a small, scoped feature8 hr
- Run a full month-end close1.7 days
- Migrate a codebase to a new framework6.7 days
Filled squares are inside the horizon. That is a coin flip on each attempt, not a guarantee, until you switch to the 80 percent setting.
METR, Kwa et al., arXiv:2503.14499. The mid-2025 reading is measured; everything either side is that anchor walked along METR's published seven month doubling, and carries wide error bars. The 80 percent setting applies METR's finding that the higher-reliability horizon runs about a quarter as long. Log scale.
Read the fine print, because it changes what you should delegate. The eighty percent reliability horizon is about a quarter of the fifty percent horizon. Success is near total on tasks under four minutes and drops below ten percent on tasks over about four hours. So the honest summary is not that agents are approaching human parity. It is that agents are excellent at short, bounded jobs and still fall apart on long ones, and the boundary moves about one doubling every seven months.
›What the benchmarks say, and what they hide
On SWE-bench Verified, frontier models went from seventy five to eighty one percent in six months, and OpenAI has since called the benchmark saturated for frontier measurement. On the harder successor, SWE-Bench Pro, GPT-5 and Claude Opus 4.1 score around twenty three percent. Same models, same week, wildly different picture.
OpenAI’s GDPvalis the more interesting test: one thousand three hundred and twenty real tasks across forty four occupations, written by professionals averaging fourteen years of experience. Human experts averaged four hundred and four minutes and three hundred and sixty one dollars per task. In Artificial Analysis’s replication the best model reached a forty seven point six percent win rate against those experts.
Why long jobs still break
There is a piece of arithmetic that explains more failed agent projects than any other, and it fits on one line. If a single step succeeds with probability p, a chain of N steps with no recovery succeeds at p to the power of N.
Interactive, figure 3
The arithmetic that kills long agent workflows
35.8%
end to end, no recovery
Split it. This is two workflows pretending to be one.
Try a real one
20 steps at 95% each leaves 35.8% of runs finishing clean. The other 64.2% land on a human.
Not a study. This is p to the power of N, plotted. It assumes no recovery between steps, which is exactly what a naive agent chain gives you.
Ninety five percent per step sounds like a working system. Chain twenty of those steps and the workflow succeeds about a third of the time. Fifty steps and you are at eight percent. This is why benchmark scores and production reliability diverge so violently, and why every deployment that actually works has a human sitting on the exception path. Human in the loop is not caution. It is the only thing that stops the exponent.
It also tells you what to hand an agent this quarter. Short, well bounded sub processes with a checkable output. Not functions. Not roles. Sub processes.
Everyone has adopted it. Almost nobody has captured it
McKinsey surveyed nearly two thousand respondents across a hundred and five countries in late 2025. Eighty eight percent of organisations use AI in at least one function. Thirty nine percent report any EBIT impact at all, and most of those say it is under five percent of EBIT. Six percent qualify as high performers. BCG, working from a different sample, found five percent achieving value at scale and sixty percent reporting little or none.
Figure 4
From adoption to value, as a funnel
Hover a row for its source.
McKinsey State of AI, November 2025, n=1,993 across 105 countries. Final row from BCG, The Widening AI Value Gap, September 2025, n=1,250+. Different samples and definitions, shown together for shape rather than for arithmetic.
MIT’s ninety five percent is the sharpest version of the same finding, and it is also the most abused statistic of the last two years. It measures deployments with no measurable profit and loss impact, which is mostly a story about pilots launched without a baseline rather than about technology that does not work. Use it to argue for measurement discipline. Do not use it to argue that AI fails.
›The three sub-findings that matter more than the headline
Purchased and partnered solutions succeeded about sixty seven percent of the time against roughly thirty three percent for internal builds. Build your own only when the workflow is genuinely yours.
Around ninety percent of employees were using personal AI tools while only about forty percent of companies had official licences. That shadow AI number is not a governance problem first. It is demand your official pilot failed to capture.
The divide tracked approach, meaning workflow integration, memory and feedback loops, rather than model quality. Corroborating from elsewhere: S&P Global found forty two percent of companies abandoning most AI initiatives in March 2025, up from seventeen percent a year earlier, and Gartner expects over forty percent of agentic projects to be cancelled by the end of 2027.
What the printing press actually did, and how long it took
Gutenberg’s press is the analogy everyone reaches for and almost nobody checks.Jeremiah Dittmar checked it. Book prices fell by about two thirds between 1450 and 1500, then kept falling at roughly two point four percent a year for a century, which is a modern rate of productivity growth achieved in the fifteenth century. Within fifty years presses reached more than two hundred and thirty towns and produced over thirty five thousand editions.
Here is the part that should reassure and terrify you in equal measure. Cities that adopted the press before 1500 had no prior growth advantage. They were ordinary. Then, between 1500 and 1600, they grew about thirty percentage points faster than everyone else.
Figure 5
Print-adopting cities had no head start, then pulled away for a century
Jeremiah Dittmar, using distance from Mainz as an instrument. Early adopters grew an extra 0.18 log points between 1500 and 1600 against an average of 0.27. Schematic rendering of the published result.
Fifty years of no measurable payoff, then a century of divergence. Dittmar and Seabold went further, looking at seven thousand printing firms, and found the strongest link was not with printing itself but with what was printed. Cities that printed business education material grew. The technology was necessary. The application was decisive.
Electricity ran the same course. Paul David’s dynamo paperputs about forty years between the practical dynamo and the productivity surge of the 1920s, because factories had to be rebuilt around unit drive and single storey layouts before the electricity was worth anything. Solow’s line about computers being visible everywhere except the productivity statistics held from 1987 until the mid nineties.
Every time, the binding constraint was organisational redesign, not the machine. Every time, the people who said the machine was overhyped were right for about a decade, then wrong for a century.
The bottega comes back
The Renaissance workshop was a small number of humans directing a much larger number of hands. A master, a few journeymen, a shop full of apprentices producing work that went out under one name. That structure is reappearing, and the cleanest evidence is revenue per employee.
Figure 6
Revenue per employee at AI-native firms
Hover a row for the detail.
Company reported and press estimated figures: Anysphere at roughly $2B annualised on a team reported between 150 and 300; Midjourney at about $2M per head; OpenAI, Anthropic, Runway and Perplexity above $1M. Typical SaaS figure is an industry benchmark, shown for scale.
Anysphere took Cursor from zero to a hundred million in annual recurring revenue in about a year, then to a billion by November 2025, with a team most reports put between a hundred and fifty and three hundred people. Midjourney does around two million dollars of revenue per head with roughly forty people. The historical comparators are Instagram at thirteen employees and a billion dollars, and WhatsApp at fifty five employees and nineteen billion.
The one person unicorn is still a claim rather than a documented fact, and I would treat anyone who tells you otherwise as selling something. But the direction is not ambiguous. Leverage per human is rising, and the roles appearing on org charts to capture it have names now: agent ops, forward deployed engineer, manager of agents.
The canaries
The best identified labour signal we have comes from Brynjolfsson, Chandar and Chen at Stanford, working from ADP payroll data through June 2026. Workers aged twenty two to twenty five in AI exposed occupations are running about nineteen percent below where they would otherwise be, relative to less exposed peers. Earlier drafts of the paper said thirteen to sixteen percent. The gap has widened since August 2025.
Figure 7
Employment for 22 to 25 year olds in AI-exposed occupations, against trend
Brynjolfsson, Chandar and Chen, Canaries in the Coal Mine, Stanford Digital Economy Lab. August 2026 revision, using ADP payroll data through June 2026. Intermediate points reflect successive drafts.
Four things about that finding deserve saying plainly. There is no economy wide displacement in the data. The effect operates through reduced hiring rather than layoffs. There is no comparable effect for experienced workers. And it concentrates where AI automates rather than augments. That is a specific, mechanical finding about the bottom rung of the ladder, and it is a long way from the headlines it generated.
›On Amodei's forecast, and forecasts generally
In March 2025 Dario Amodei said AI would be writing ninety percent of code within three to six months and essentially all of it within twelve. That did not happen on schedule, and he later softened it. In May 2025 he told Axios that AI could wipe out half of entry level white collar jobs and push unemployment to ten or twenty percent within one to five years. That one is still open.
The AI 2027 scenarioput superintelligence in December 2027. Its own authors have since moved: Daniel Kokotajlo now says around 2030, with lots of uncertainty. I cite these not to dunk on them but because the same people producing the best analysis in this field keep getting the dates wrong in the same direction, and that is useful information about how to read anyone’s timeline, mine included.
The strongest case against all of this
If I only argued one side this would be marketing. So here is the case against, made as well as I can make it.
Experienced developers got slower. METR ran a randomised controlled trial in July 2025with sixteen experienced open source developers on two hundred and forty six real tasks in repositories they knew well. With AI they took nineteen percent longer. Having just been slowed down, they believed they had been sped up by twenty percent. That is a thirty nine point gap between what happened and what it felt like, and it should make you deeply suspicious of every self reported productivity gain in this industry, including your team’s. METR’s February 2026 follow up found likely speedups for the same developers, though with weak evidence and selection effects. Treat the original as a snapshot of early 2025 tools on hard, familiar code.
The perception gap
Sixteen experienced developers, 246 real tasks, and a 39 point gap between the stopwatch and the feeling
METR randomised controlled trial, July 2025. Developers forecast a 24 percent speedup before starting. A February 2026 follow up found likely speedups for the same people, on weaker evidence.
Output is getting worse in a way that is hard to see. BetterUp Labs and the Stanford Social Media Lab surveyed eleven hundred and fifty US employees about workslop, meaning AI generated work that looks finished and is not. Recipients reported trust in the sender falling forty two percent and perceived effort falling forty nine percent. About eighteen percent admitted producing it. The cost lands downstream of the person who booked the productivity win.
The clearest success story rolled back.Klarna’s assistant handled two point three million chats in its first month, work the company equated to seven hundred full time agents, cutting resolution time from eleven minutes to under two. In May 2025 the chief executive said they went too far, that they had focused too much on cost and the result was lower quality, and started rehiring. Klarna disputes the reversal framing, and says the AI now does the work of over eight hundred roles. The honest read is that the AI handled the volume and the scope was corrected on the complex, emotional cases. That is a scope correction, not a retreat, but it is not the clean story either.
The macro case may just be small. Goldman Sachs forecasts seven percent added to global GDP over a decade, about seven trillion dollars. Daron Acemoglu, modelling only the tasks profitably automatable within ten years, gets roughly one percent. That is an order of magnitude apart, and both are forecasts rather than findings. Arvind Narayanan and Sayash Kapoor’s position, that AI is normal technology whose impact is gated by adoption over decades, is the intellectually serious version of the skeptical case, and nothing in the data currently refutes it.
Here is why I still think the renaissance framing survives all of that: the analogy predicts exactly this lag. Fifty years of no measurable payoff after Gutenberg. Forty years between the dynamo and the productivity surge. A decade of Solow’s paradox. If the value showed up immediately, the historical parallel would be wrong.
Choose your ending
Two futures fit the current evidence. I lean toward the first, but the second is not a strawman and I would not bet the company on the difference. Pick one and read what it commits you to.
Organisations redesign, and the capability curve finally shows up in the accounts.
The teams that redesigned the work around agents pull away, the way print cities pulled away after 1500. Value concentrates in the firms that fixed their data and their processes, not the firms that bought the best model, because everyone can rent the same model for a tenth of a cent.
The measurable macro effect arrives late and then arrives fast, on the <Src id="j-curve">J curve shape Brynjolfsson, Rock and Syverson describe</Src>. Revenue per employee at ordinary companies starts to look like the numbers only AI native firms post today.
Watch for: workflow redesign showing up in EBIT reporting, and revenue per employee rising at firms that were never software companies.
What is worth noticing is that the operational advice is identical either way. In both endings, the firms that redesigned the work around the machines do better than the firms that bought the machines. The scenarios differ on timing and magnitude, not on what you should do on Monday.
›The constraint nobody was modelling: power
The four largest US hyperscalers have guided to about seven hundred and twenty five billion dollars of combined capital expenditure in 2026, up roughly seventy seven percent from four hundred and ten billion in 2025, and Goldman projects five point three trillion across 2025 to 2030. Data centres are now power constrained with lengthening delivery timelines. If inference prices stop falling, or reverse, the outcome pricing arithmetic in the third section changes and so does everything built on it. That, rather than model quality, is the input I would watch.
What to actually do
Four stages, each with a gate you have to pass before the next one. The gates matter more than the stages, because the failure mode is not moving too slowly. It is spending three quarters in a pilot nobody ever defined success for.
- I
Weeks 0 to 4
Diagnose before you build
Find one boring, high frequency, rule dense workflow that is already instrumented. Write down its cost per transaction, cycle time and quality metric before anything touches it.
Gate: If you cannot name the baseline, do not proceed.
- II
Months 1 to 3
Buy narrow, wire deeply
Prefer a purchased vertical agent to an internal build. Fix the data and permissions plumbing, stand up evals and observability, and design the human exception path on day one rather than after the first bad week.
Gate: The agent hits its resolution target on the eval set before any headcount decision.
- III
Months 3 to 9
Redesign the work, then scale
Rebuild the process around the agent instead of bolting the agent onto the legacy process. Move the pricing conversation from seats to outcomes while you are at it.
Gate: A measurable delta against the Stage I baseline. If there is none after two quarters, kill it or rescope it.
- IV
Months 6 to 18
Build the shop around the machines
Make someone the manager of agents, with the title and the time. Convert the shadow AI everyone is already using into governed capability rather than pretending it is not happening.
Gate: Revenue per employee, and supervised throughput per human.
Three triggers should make you rewrite the plan rather than continue it. If METR’s doubling breaks its cadence in either direction, re-forecast what agents can own. If power constraints push inference prices up, re-run the outcome pricing maths. If the Stanford entry level signal reverses, revisit your hiring assumptions.
Find out what agentic workflows would save your team.
Stage I of the playbook above, run for you. The $999 assessment identifies 5 to 10 hours per week of recoverable time, with a money-back guarantee if it does not.
Get the Assessment →Sources and caveats
Load bearing claims lean on the independent work: METR on time horizons and on the developer trial, MIT NANDA on deployment outcomes, Stanford’s Digital Economy Lab on early career employment, and Dittmar on the printing press. Resolution rates and savings figures from Intercom, Sierra and Klarna are vendor or vendor adjacent and are labelled as such above. Ramp’s adoption dataskews toward startups and venture backed firms, which is why it runs far above the Census Bureau’s survey numbers.
Menlo, McKinsey and BCG figures come from different samples measuring different things, spend against adoption against value at scale, and should not be blended into a single headline. The spend rail joins Menlo’s 2023 to 2025 readings to ABI Research’s separate forecast of almost $220B in 2030; the endpoint is a forecast, not a continuation of Menlo’s measurement. The inference-price endpoint is a conservative scenario informed by Gartner’s provider-cost forecast, not a quoted customer API price. Goldman’s seven percent, Acemoglu’s one percent, the AI 2027 timeline and Amodei’s code forecast are projections, and two of them have already missed.